Adds a gradient legend to a plot.
add_legend(
  zlim,
  col,
  alpha = 1,
  lgd_box_col = NULL,
  lgd_x_pct = 0.5,
  lgd_y_pct = 0.5,
  lgd_wd_pct = 0.5,
  lgd_ht_pct = 0.5,
  bar_box_col = "black",
  bar_wd_pct = 0.2,
  bar_ht_pct = 1,
  text_cex = 1,
  text_col = NULL,
  text_font = NULL,
  text_x_pct = 1,
  ticks = NULL,
  ticks_n = 5
)
Arguments
- zlim
two-element numeric vector; required; the min and max value of z
- col
character vector; required; the colors that will be used in the legend.
- alpha
numeric; transparency of the colors. Must be in the range 0-1, where 0 is fully transparent and 1 is fully opaque. Default is 1.
- lgd_box_col
character; color of the box to draw around the entire legend. If
NULL(the default), no box is drawn- lgd_x_pct
numeric; location of the center of the legend in the x-dimension, as a fraction (0 to 1) of the right margin area, not the entire width of the figure
- lgd_y_pct
numeric; location of the center of the legend in the y-dimension, as a fraction (0 to 1). Unlike
lgd_x_pct, this is relative to the entire figure height (since the right margin area spans the entire vertical dimension)- lgd_wd_pct
numeric; width of the entire legend, as a fraction (0 to 1) of the right margin width
- lgd_ht_pct
numeric; height of the entire legend, as a fraction (0 to 1) of the figure height
- bar_box_col
character; color of the box to draw around the color bar. If
NULL, no box is drawn- bar_wd_pct
numeric; width of the color bar, as a fraction (0 to 1) of the width of the legend area (not the entire right margin width)
- bar_ht_pct
numeric; height of the color bar, as a fraction (0 to 1) of the height of the legend area (not the entire right margin height)
- text_cex
numeric; size of the legend text. Default is 1.
- text_col
character; color of the legend text. Default is "black".
- text_font
integer; specifies which font to use. See
par()for more details.- text_x_pct
numeric; the x-placement of the legend text as a fraction (0 to 1) of the width of the legend area. This corresponds to the right-most part of the text - i.e. a value of 1 means the text will end exactly at the right border of the legend area. Default is 1.
- ticks
numeric vector; the z-values at which to place tick marks. If
NULL(the default), tick placement is automatically calculated- ticks_n
integer; the number of ticks desired - only used if
ticksisNULL. Note that this is an approximate number - thepretty()function is used to generate "nice-looking" values, but it doesn't guarantee a set number of tick marks
Value
no return value
Details
I took an HTML/CSS-like approach to determining the positioning -
that is, each space is treated as <div>-like space, and the position
of objects within that space happens relative to that space rather
than the entire space. The parameters prefixed by lgd are all
relative to the right margin space and correspond to the box that contains
the entire legend. The parameters prefixed by bar and ticks
are relative to the space within the legend box.
This function is used within plot(), so the
user shouldn't call this function to manually create the legend.
Customizations to the legend can be done via the legend_args
parameter of plot(). Using this function to
plot the legend after using plot() raises the
possibility of the legend not corresponding correctly with the plot, and
thus should be avoided.
Examples
library(terra)
#> terra 1.7.39
#>
#> Attaching package: ‘terra’
#> The following object is masked from ‘package:quadtree’:
#>
#> add_legend
library(quadtree)
habitat <- terra::rast(system.file("extdata", "habitat.tif", package="quadtree"))
qt <- quadtree(habitat, .2)
old_par <- par(mar = c(5, 4, 4, 5))
plot(qt, legend = FALSE)
leg <- terra::minmax(habitat)[1:2]
quadtree::add_legend(leg, rev(terrain.colors(100)))
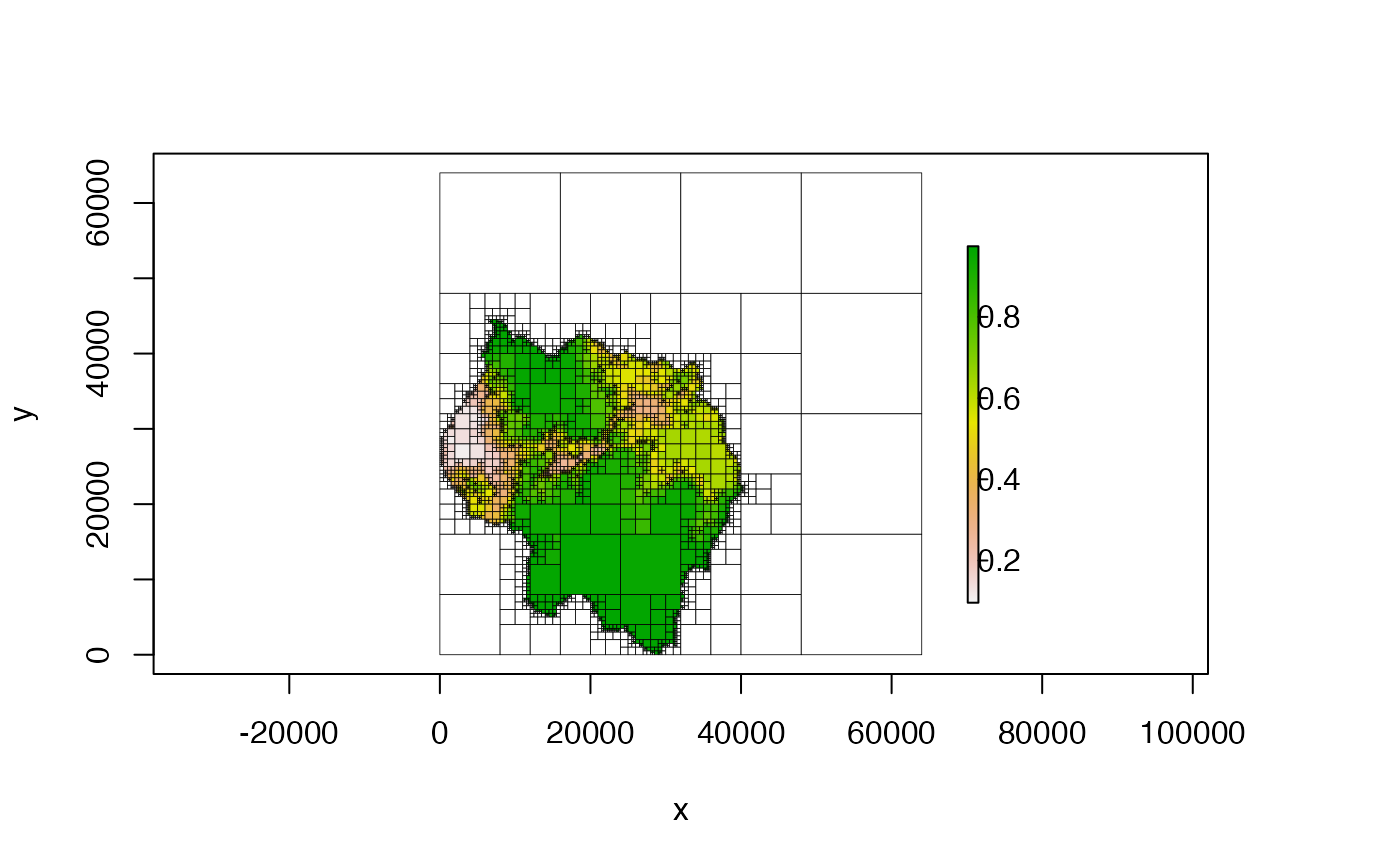 par(old_par)
# this example simply illustrates how it COULD be used, but as stated in the
# 'Details' section, it shouldn't be called separately from 'plot()' - if
# customizations to the legend are desired, use the 'legend_args' parameter
# of 'plot()'.
par(old_par)
# this example simply illustrates how it COULD be used, but as stated in the
# 'Details' section, it shouldn't be called separately from 'plot()' - if
# customizations to the legend are desired, use the 'legend_args' parameter
# of 'plot()'.