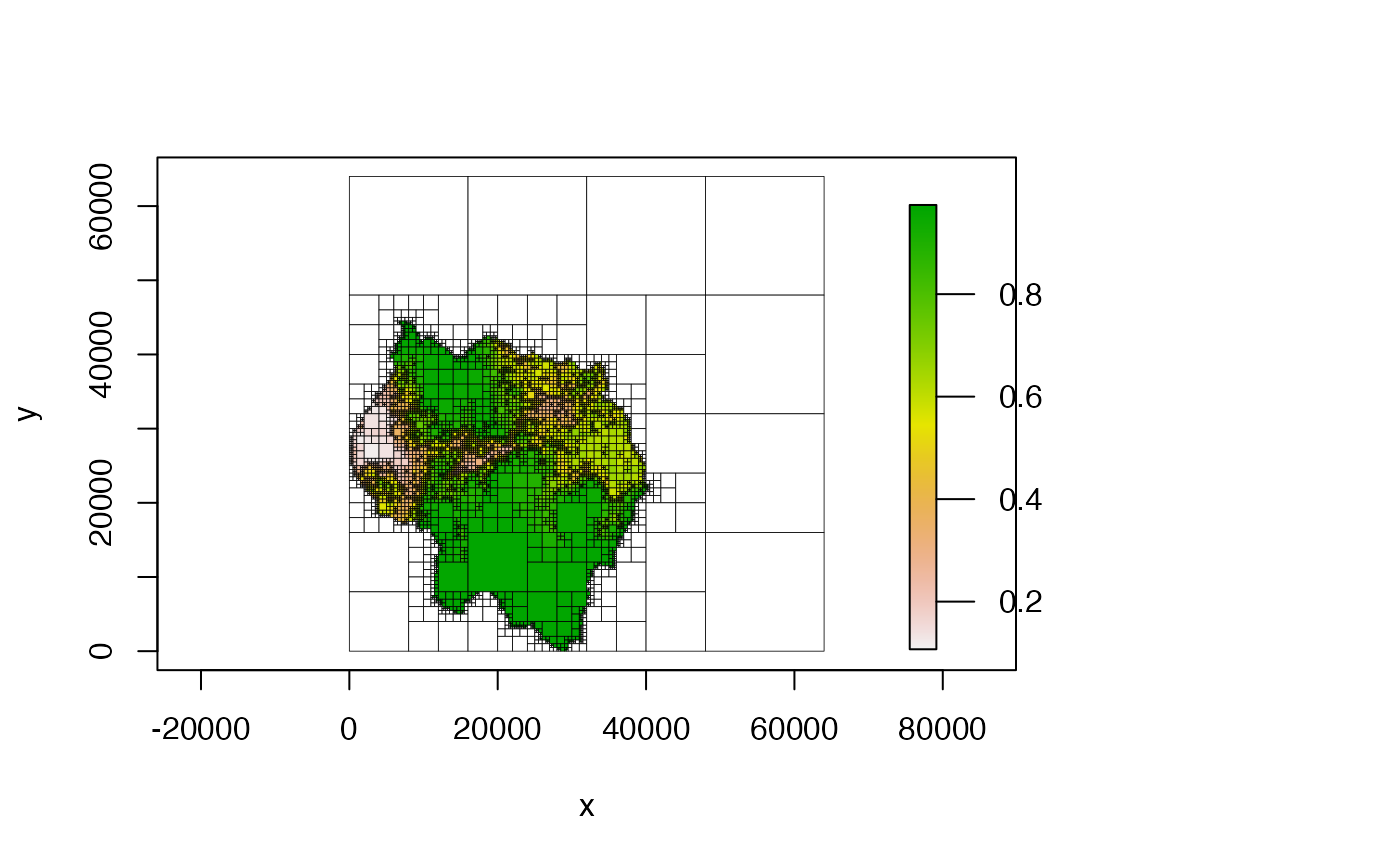
Plots a Quadtree.
# S4 method for Quadtree,missing
plot(
  x,
  add = FALSE,
  col = NULL,
  alpha = NULL,
  nb_line_col = NULL,
  border_col = "black",
  border_lwd = 0.4,
  xlim = NULL,
  ylim = NULL,
  zlim = NULL,
  crop = FALSE,
  na_col = "white",
  adj_mar_auto = 6,
  legend = TRUE,
  legend_args = list(),
  ...
)
Arguments
- x
a
Quadtree- add
boolean; if
FALSE(the default) a new plot is created. IfTRUE, the plot is added to the existing plot.- col
character vector; the colors that will be used to create the color ramp used in the plot. If no argument is provided,
terrain.colors(100, rev = TRUE)is used.- alpha
numeric; transparency of the cell colors. Must be in the range 0-1, where 0 is fully transparent and 1 is fully opaque. If
NULL(the default) it setsalphato 1.- nb_line_col
character; the color of the lines drawn between neighboring cells. If
NULL(the default), these lines are not plotted.- border_col
character; the color to use for the cell borders. Use "transparent" if you don't want borders to be shown. Default is "black".
- border_lwd
numeric; the line width of the cell borders. Default is .4.
- xlim
two-element numeric vector; defines the minimum and maximum values of the x axis. Note that this overrides the
cropparameter.- ylim
two-element numeric vector; defines the minimum and maximum values of the y axis. Note that this overrides the
cropparameter.- zlim
two-element numeric vector; defines how the colors are assigned to the cell values. The first color in
colwill correspond tozlim[1]and the last color incolwill correspond tozlim[2]. Ifzlimdoes not encompass the entire range of cell values, cells that have values outside of the range specified byzlimwill be treated asNAcells. If this value isNULL(the default), it uses the min and max cell values.- crop
boolean; if
TRUE, only displays the extent of the original raster, thus ignoring any of theNAcells that were added to pad the raster before making the quadtree. Ignored if eitherxlimorylimare non-NULL.- na_col
character; the color to use for
NAcells. IfNULL,NAcells are not plotted. Default is "white".- adj_mar_auto
numeric; checks the size of the right margin (
par("mar")[4]) - if it is less than the provided value andlegendisTRUE, then it sets it to be the provided value in order to make room for the legend (after plotting, it resets it to its original value). IfNULL, the margin is not adjusted. Default is 6.- legend
boolean; if
TRUE(the default) a legend is plotted in the right margin.- legend_args
named list; contains arguments that are sent to the
add_legend()function. See the help page foradd_legend()for the parameters. Note thatzlim,cols, andalphaare supplied automatically, so if the list contains elements namedzlim,cols, oralphathe user-provided values will be ignored.- ...
arguments passed to the default
plot()function
Value
no return value
Details
See 'Examples' for demonstrations of how the various options can be used.
Examples
library(quadtree)
habitat <- terra::rast(system.file("extdata", "habitat.tif", package="quadtree"))
# create quadtree
qt <- quadtree(habitat, split_threshold = .1, adj_type = "expand")
#####################################
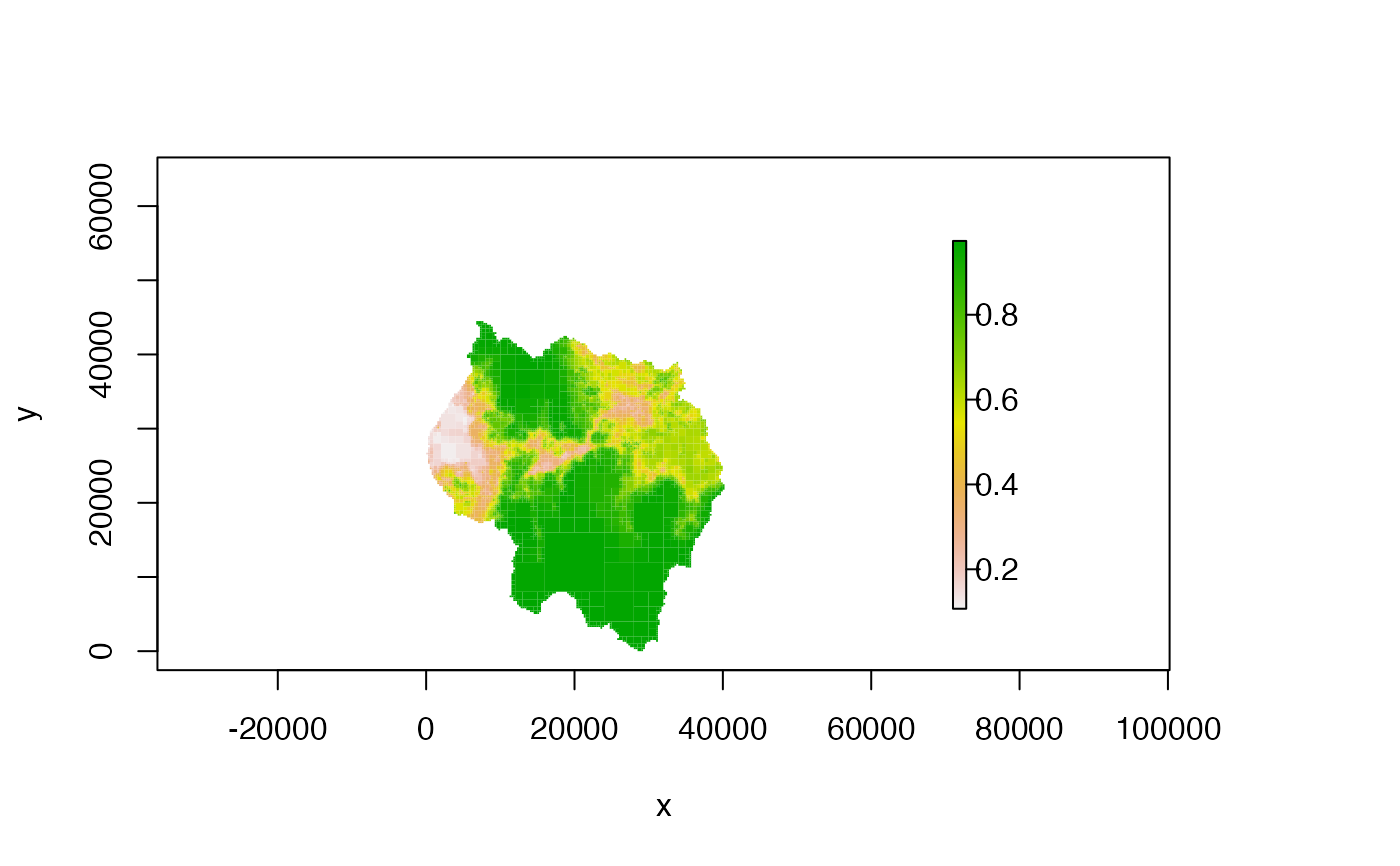
# DEFAULT
#####################################
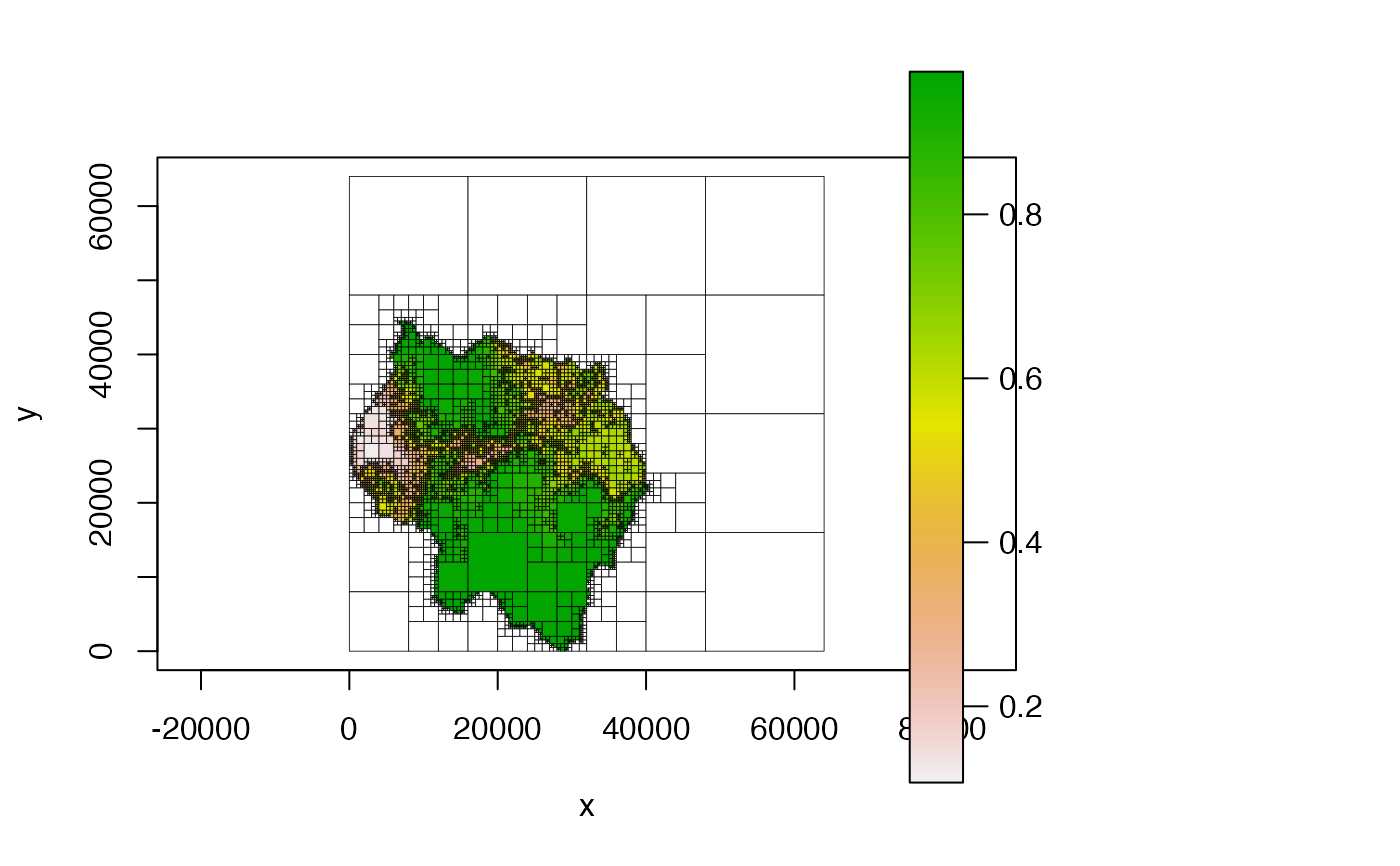
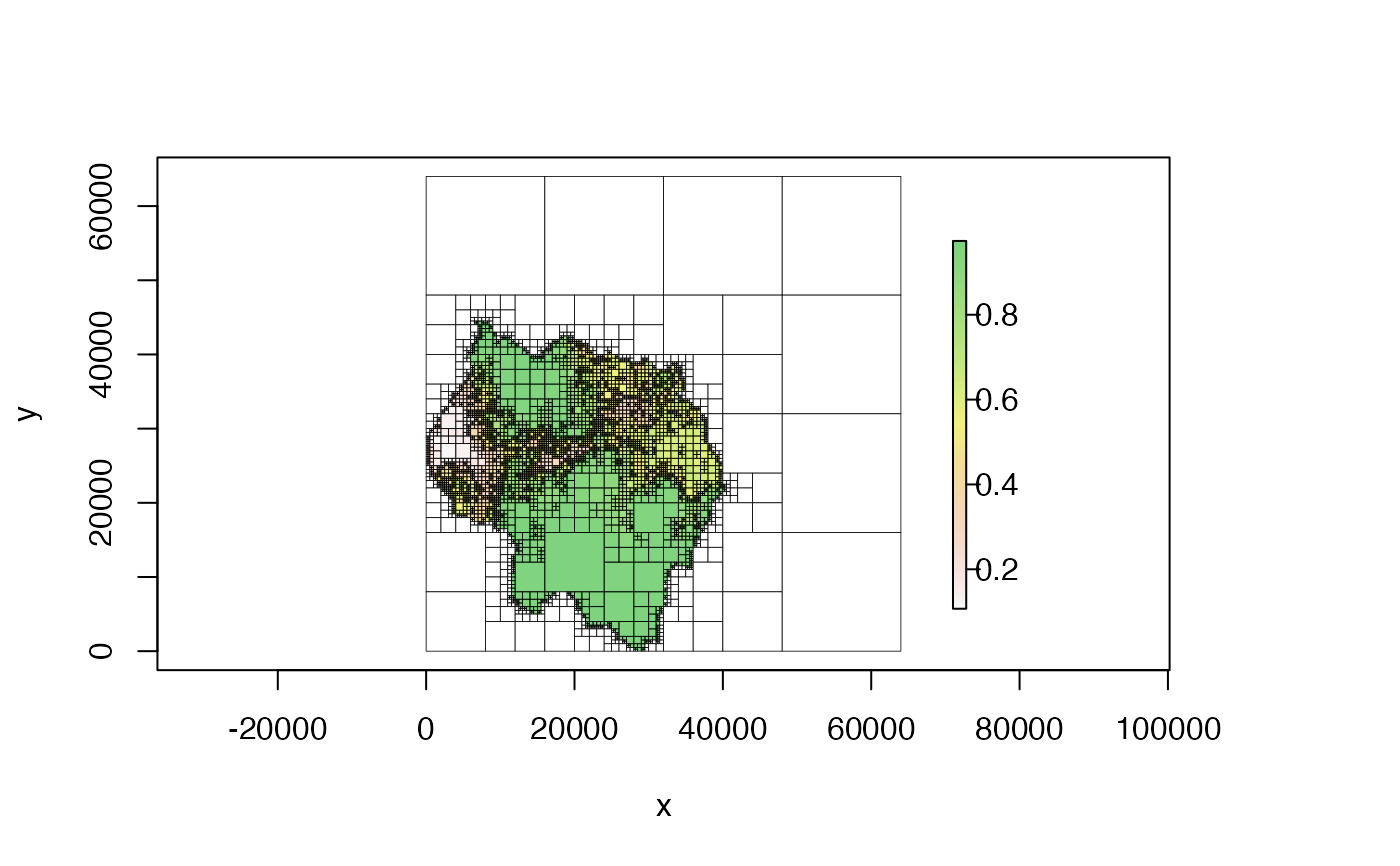
# default - no additional parameters provided
plot(qt)
 #####################################
# CHANGE PLOT EXTENT
#####################################
# note that additional parameters like 'main', 'xlab', 'ylab', etc. will be
# passed to the default 'plot()' function
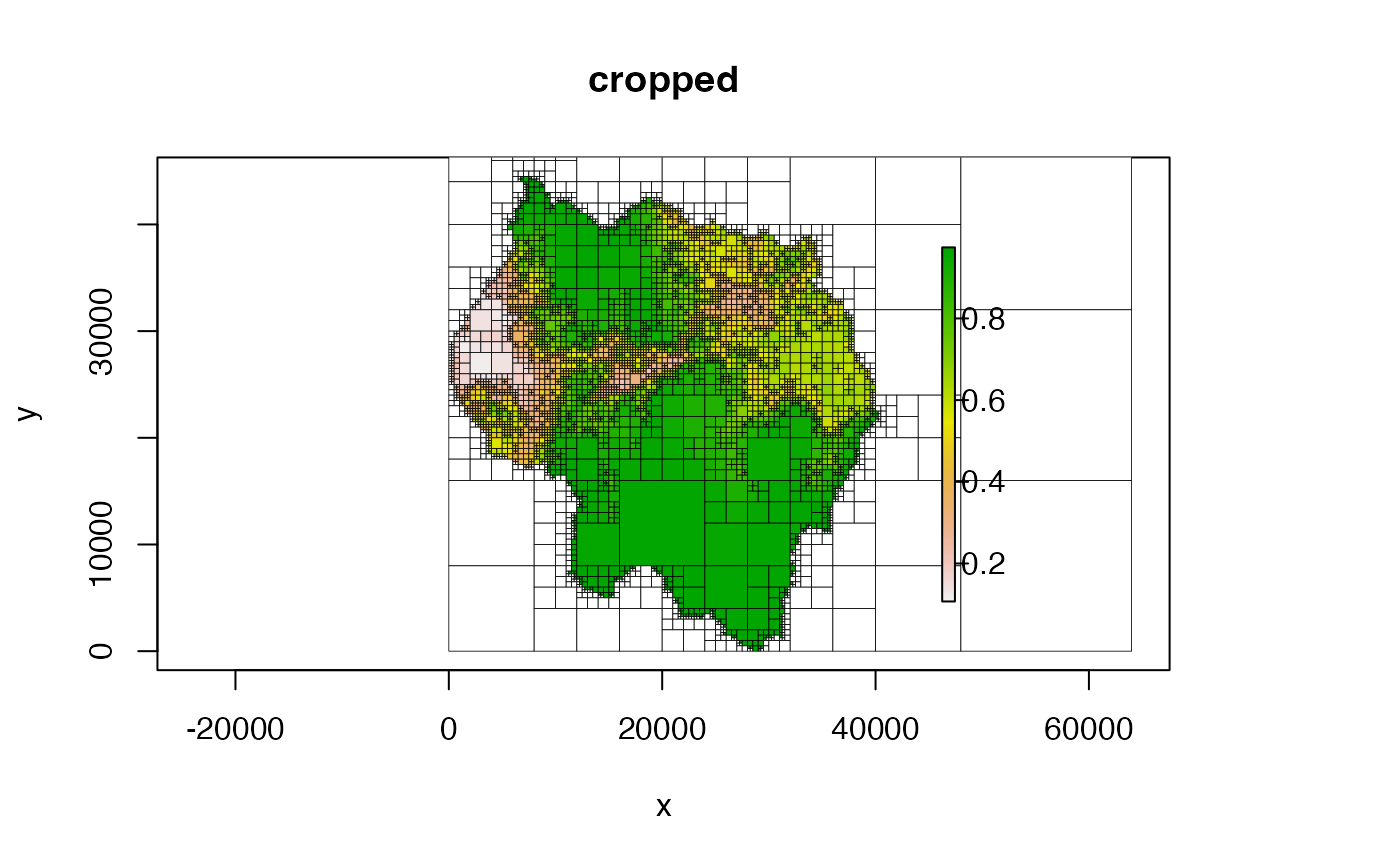
# crop extent to the original extent of the raster
plot(qt, crop = TRUE, main = "cropped")
#####################################
# CHANGE PLOT EXTENT
#####################################
# note that additional parameters like 'main', 'xlab', 'ylab', etc. will be
# passed to the default 'plot()' function
# crop extent to the original extent of the raster
plot(qt, crop = TRUE, main = "cropped")
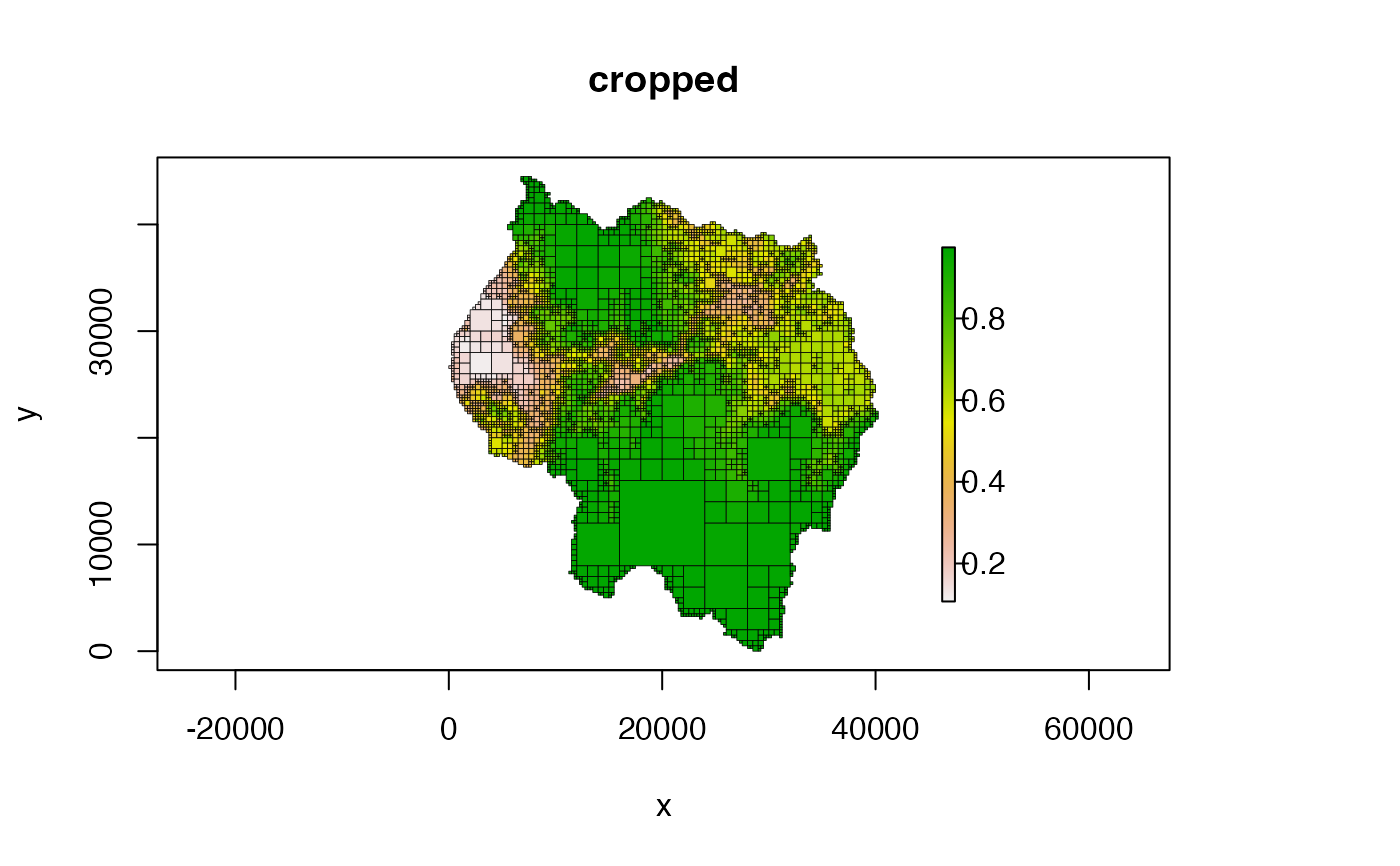
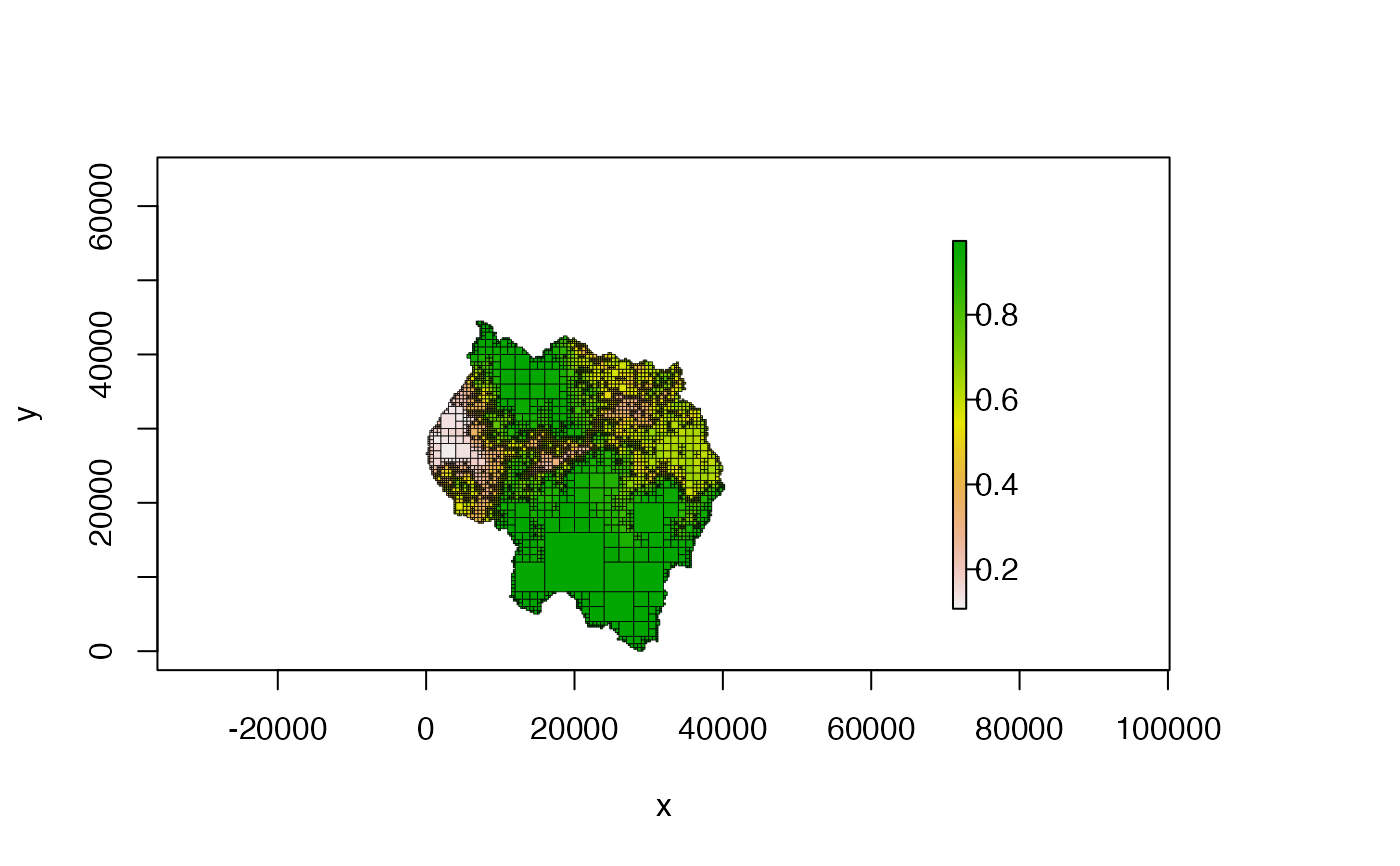
 # crop and don't plot NA cells
plot(qt, crop = TRUE, na_col = NULL, main = "cropped")
# crop and don't plot NA cells
plot(qt, crop = TRUE, na_col = NULL, main = "cropped")
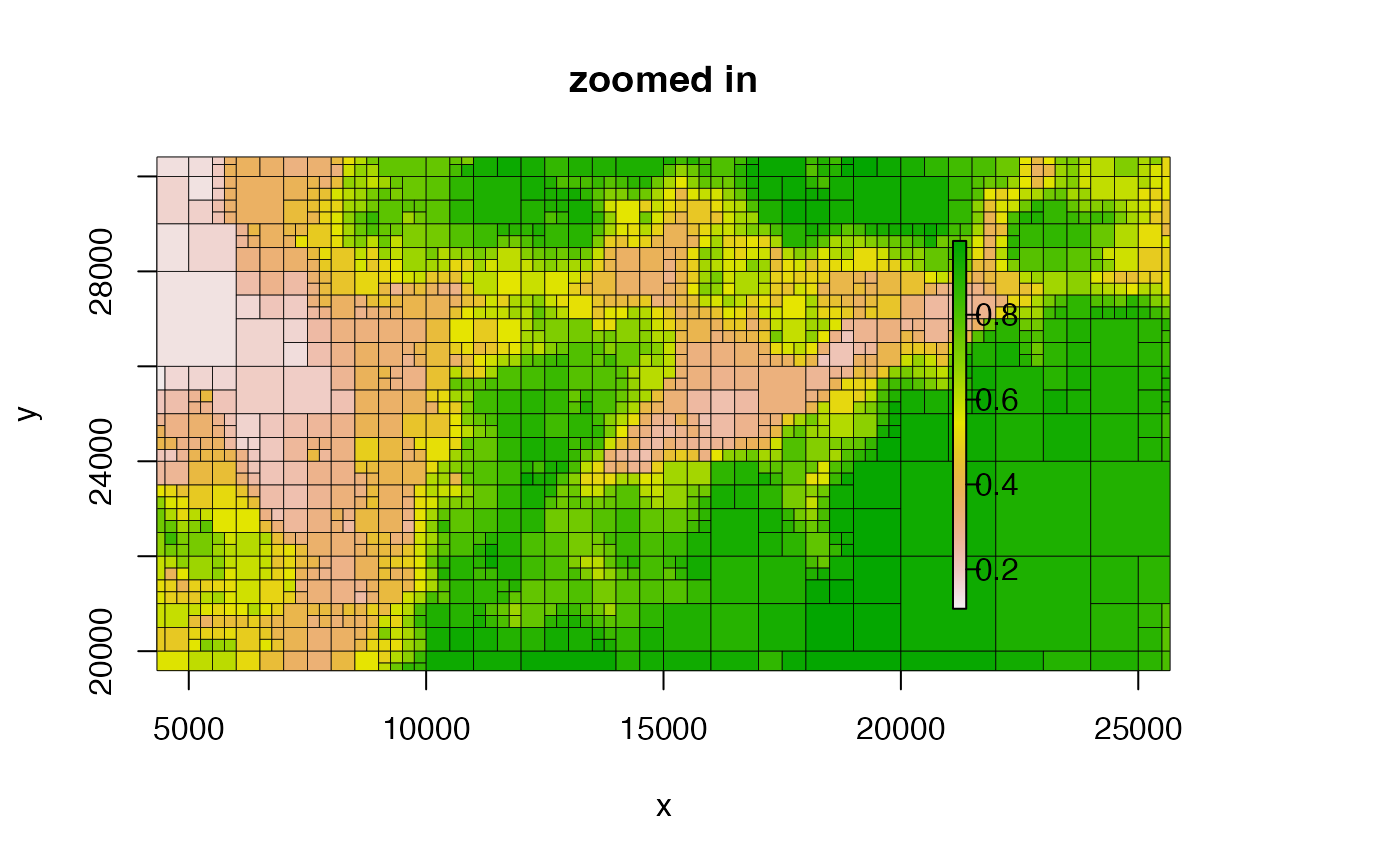
 # use 'xlim' and 'ylim' to zoom in on an area
plot(qt, xlim = c(10000, 20000), ylim = c(20000, 30000), main = "zoomed in")
# use 'xlim' and 'ylim' to zoom in on an area
plot(qt, xlim = c(10000, 20000), ylim = c(20000, 30000), main = "zoomed in")
 #####################################
# COLORS AND BORDERS
#####################################
# change border color and width
plot(qt, border_col = "transparent") # no borders
#####################################
# COLORS AND BORDERS
#####################################
# change border color and width
plot(qt, border_col = "transparent") # no borders
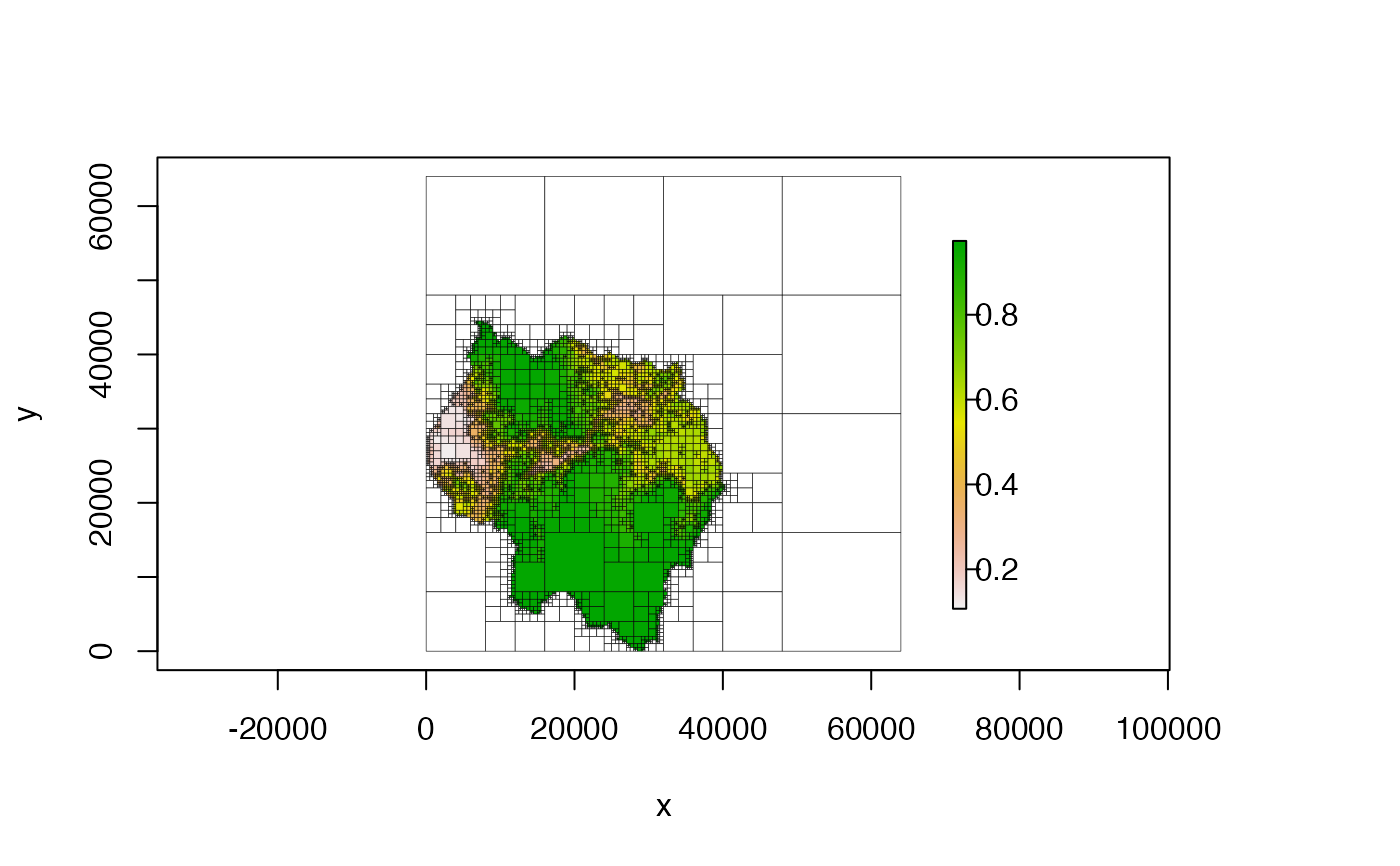
 plot(qt, border_col = "gray60") # gray borders
 plot(qt, border_lwd = .3) # change line thickness of borders
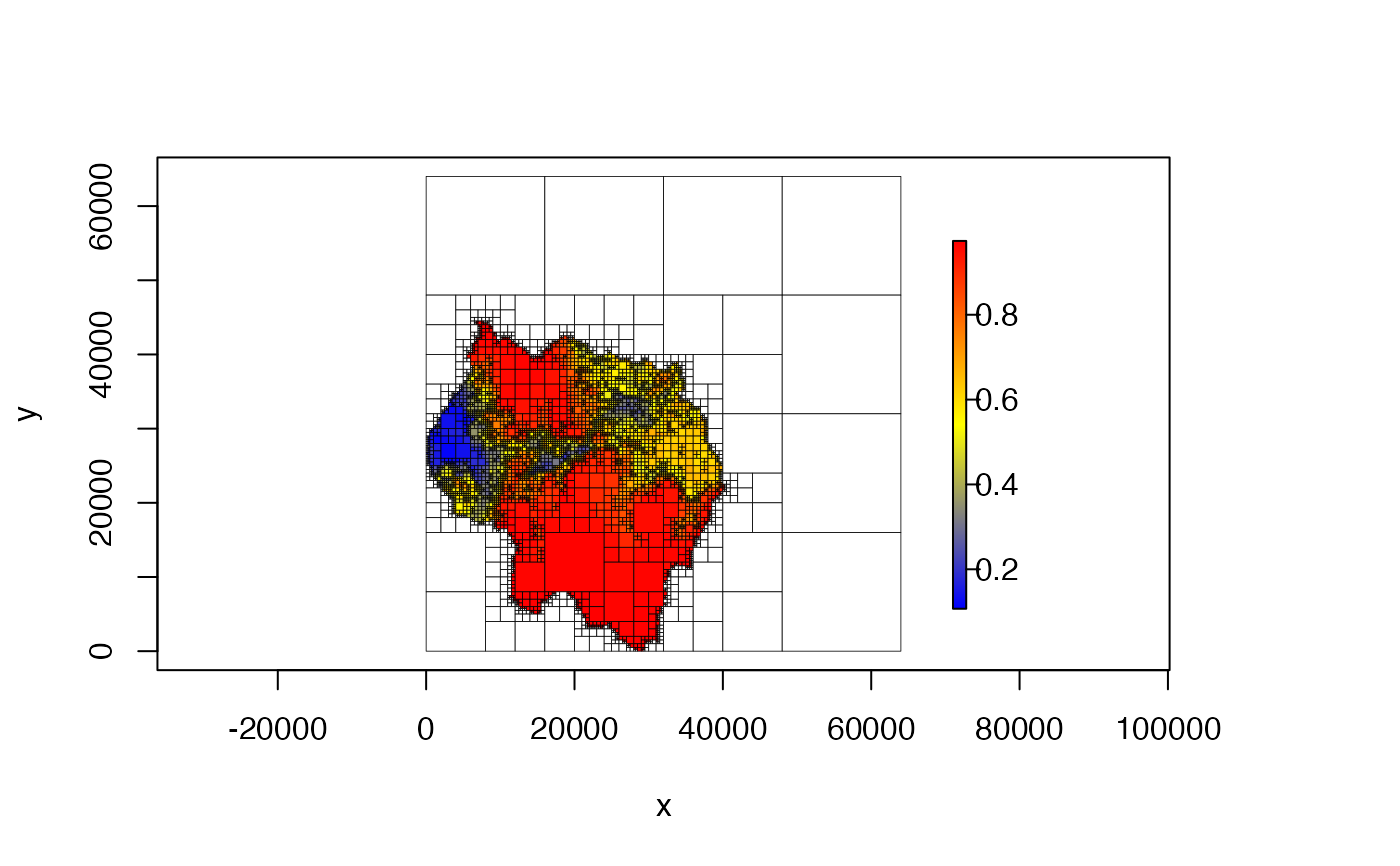
 # change color palette
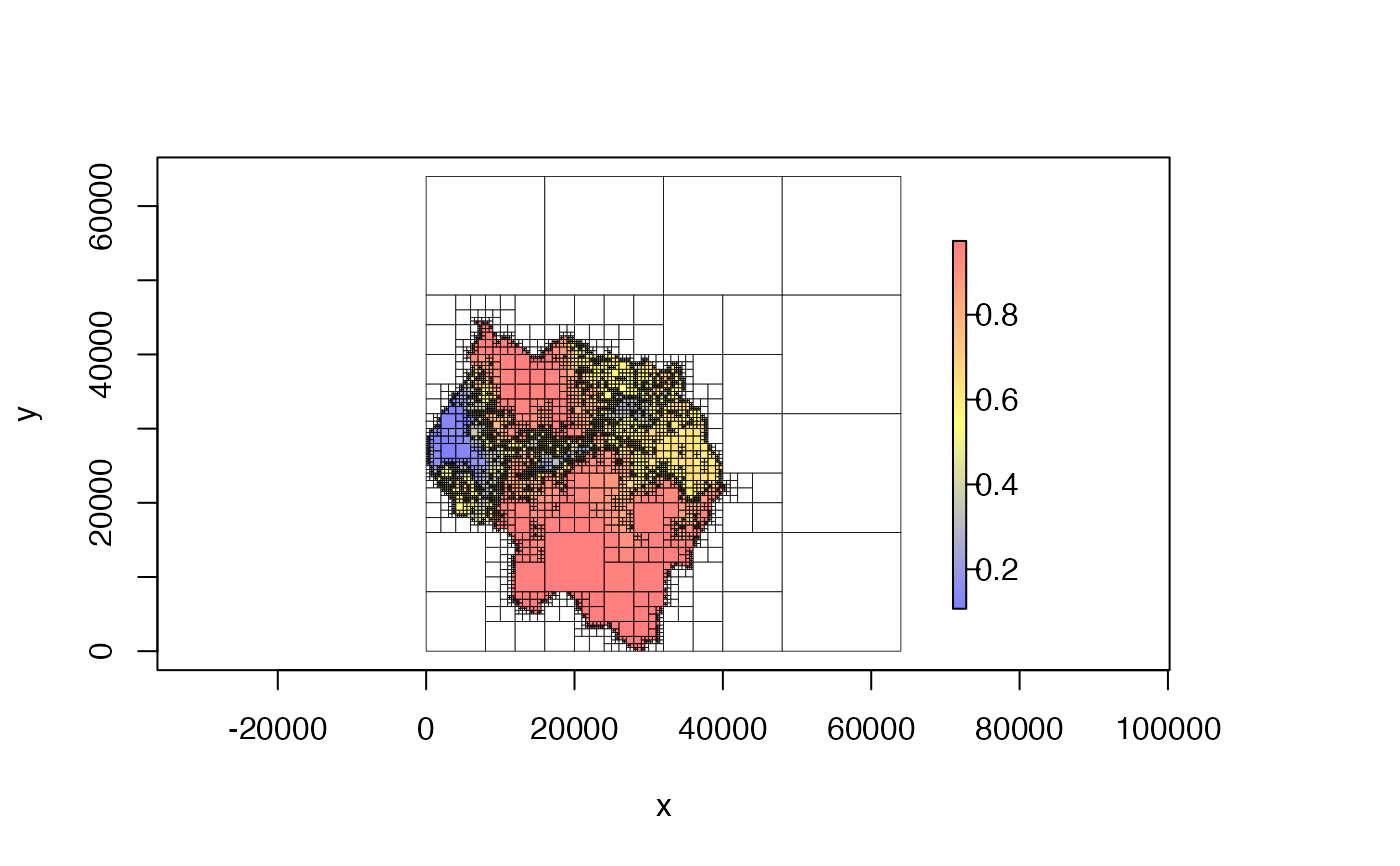
plot(qt, col = c("blue", "yellow", "red"))
# change color palette
plot(qt, col = c("blue", "yellow", "red"))
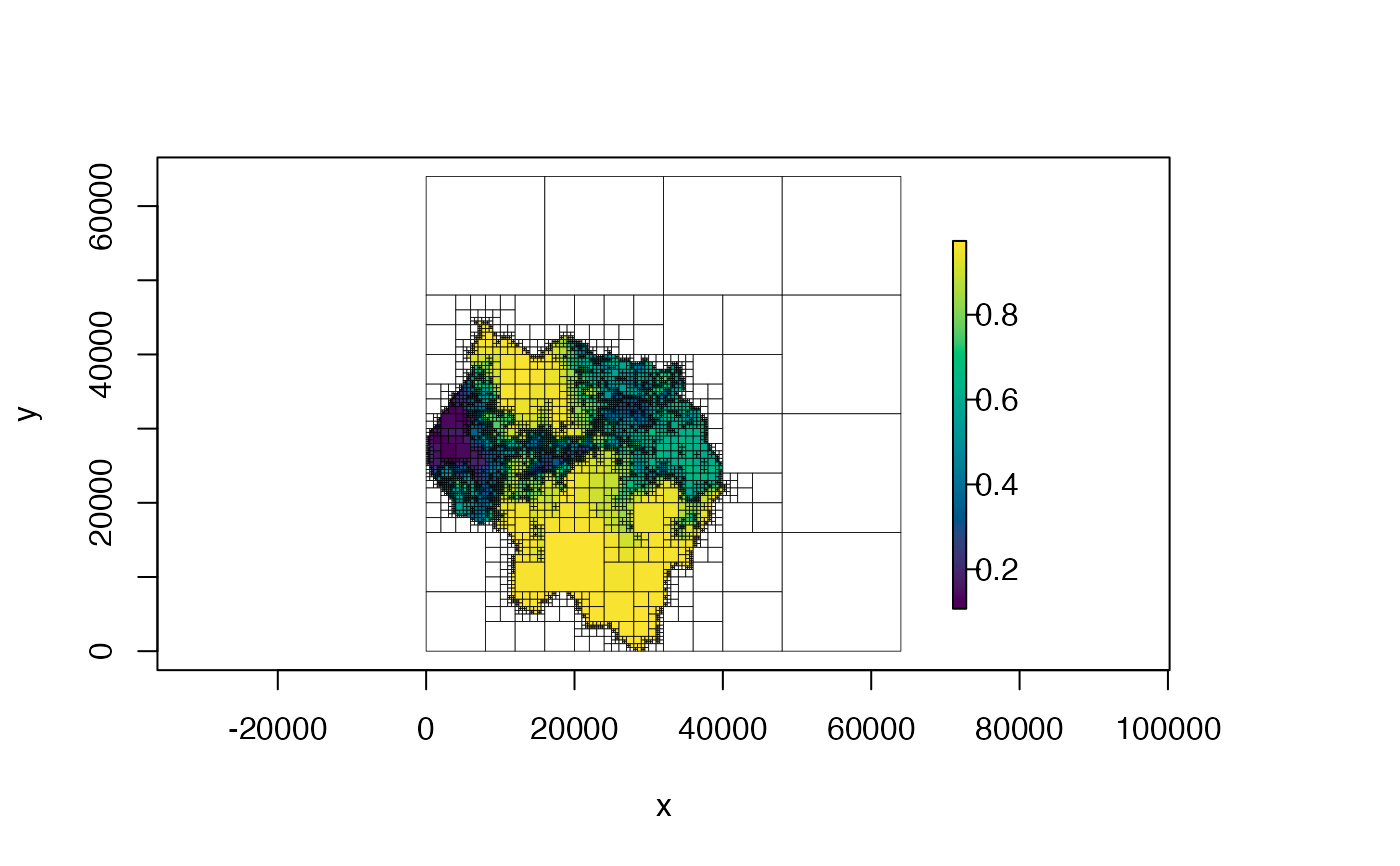
 plot(qt, col = hcl.colors(100))
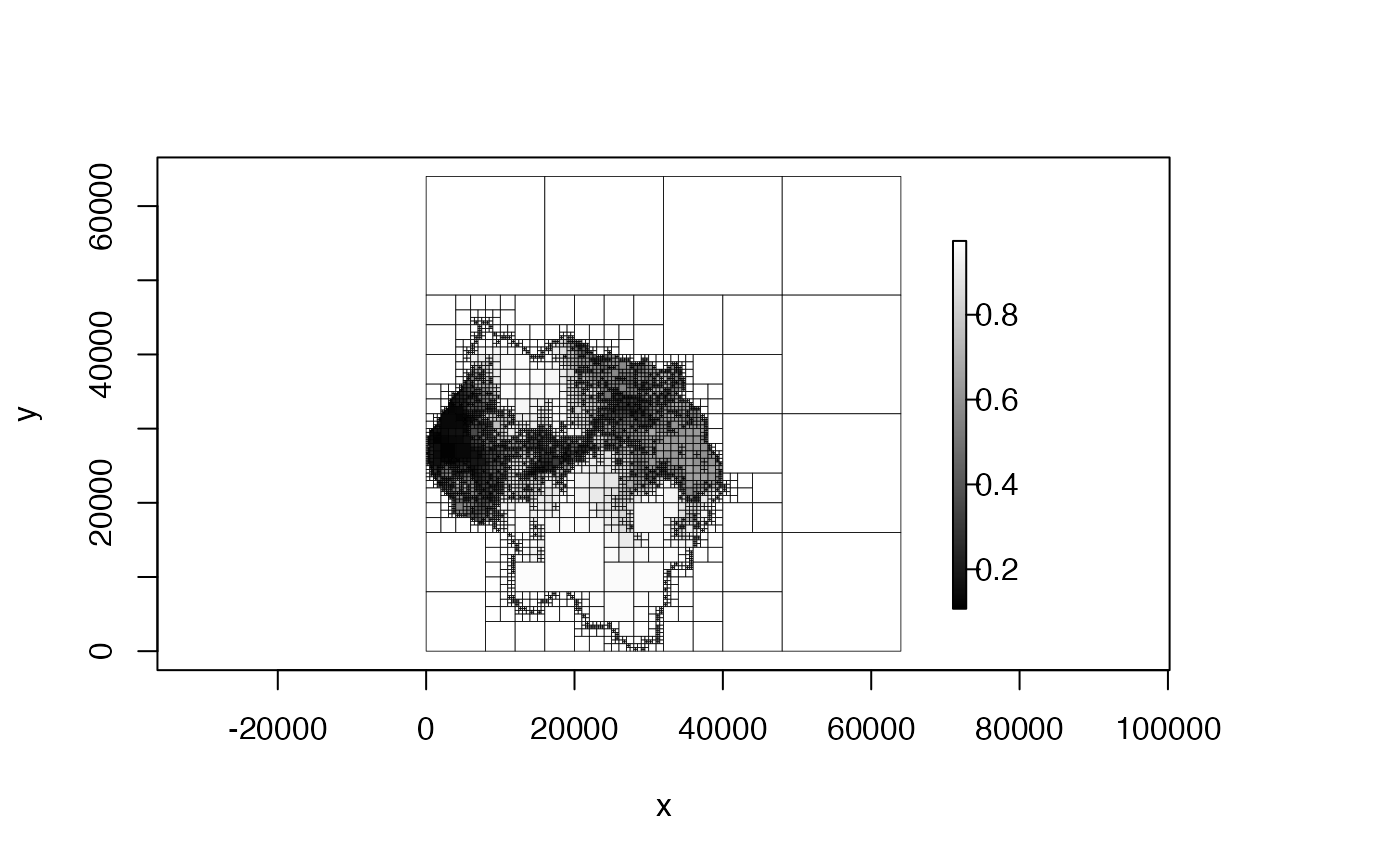
 plot(qt, col = c("black", "white"))
 # change color transparency
plot(qt, alpha = .5)
# change color transparency
plot(qt, alpha = .5)
 plot(qt, col = c("blue", "yellow", "red"), alpha = .5)
 # change color of NA cells
plot(qt, na_col = "lavender")
# change color of NA cells
plot(qt, na_col = "lavender")
 # don't plot NA cells at all
plot(qt, na_col = NULL)
# don't plot NA cells at all
plot(qt, na_col = NULL)
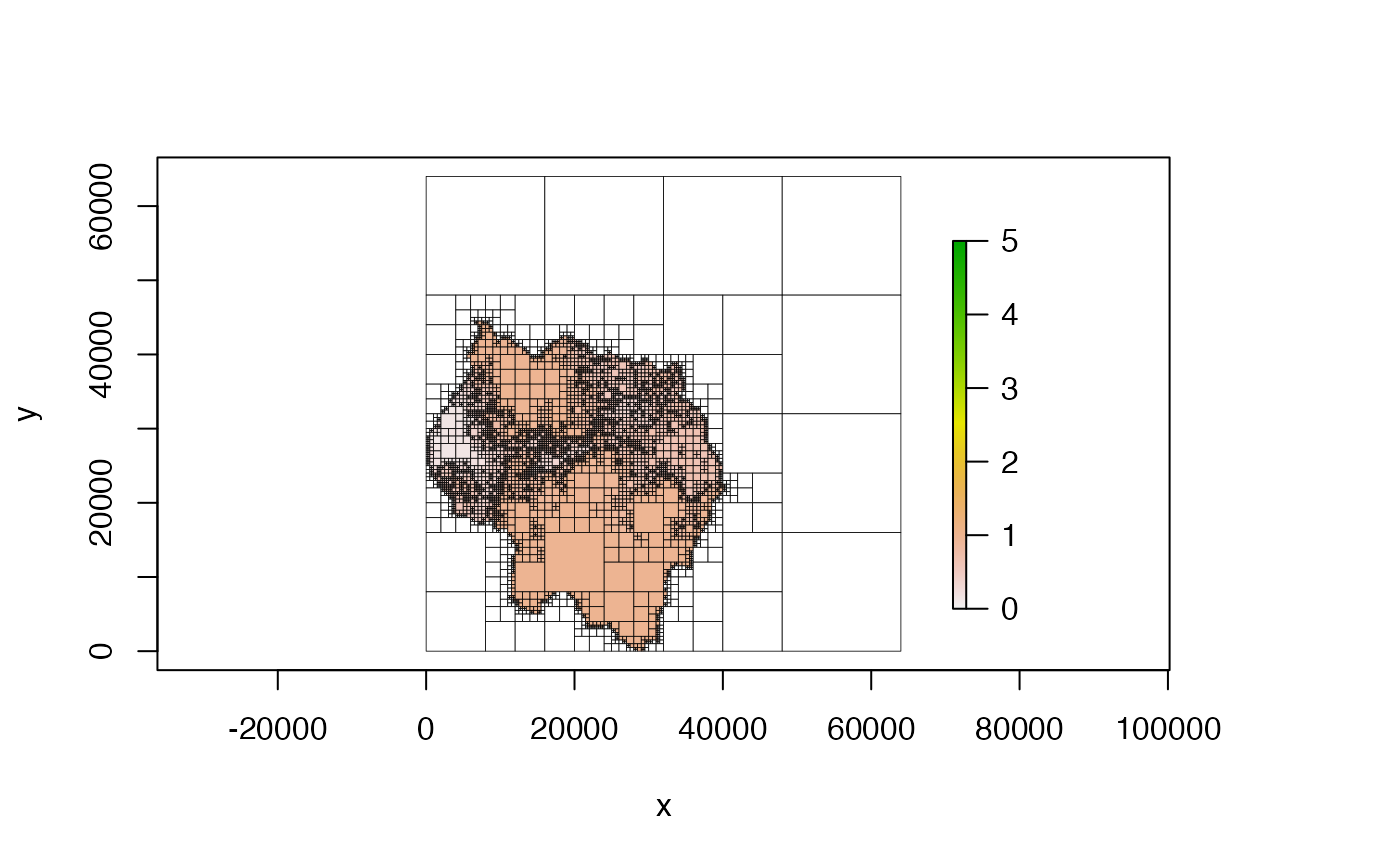
 # change 'zlim'
plot(qt, zlim = c(0, 5))
# change 'zlim'
plot(qt, zlim = c(0, 5))
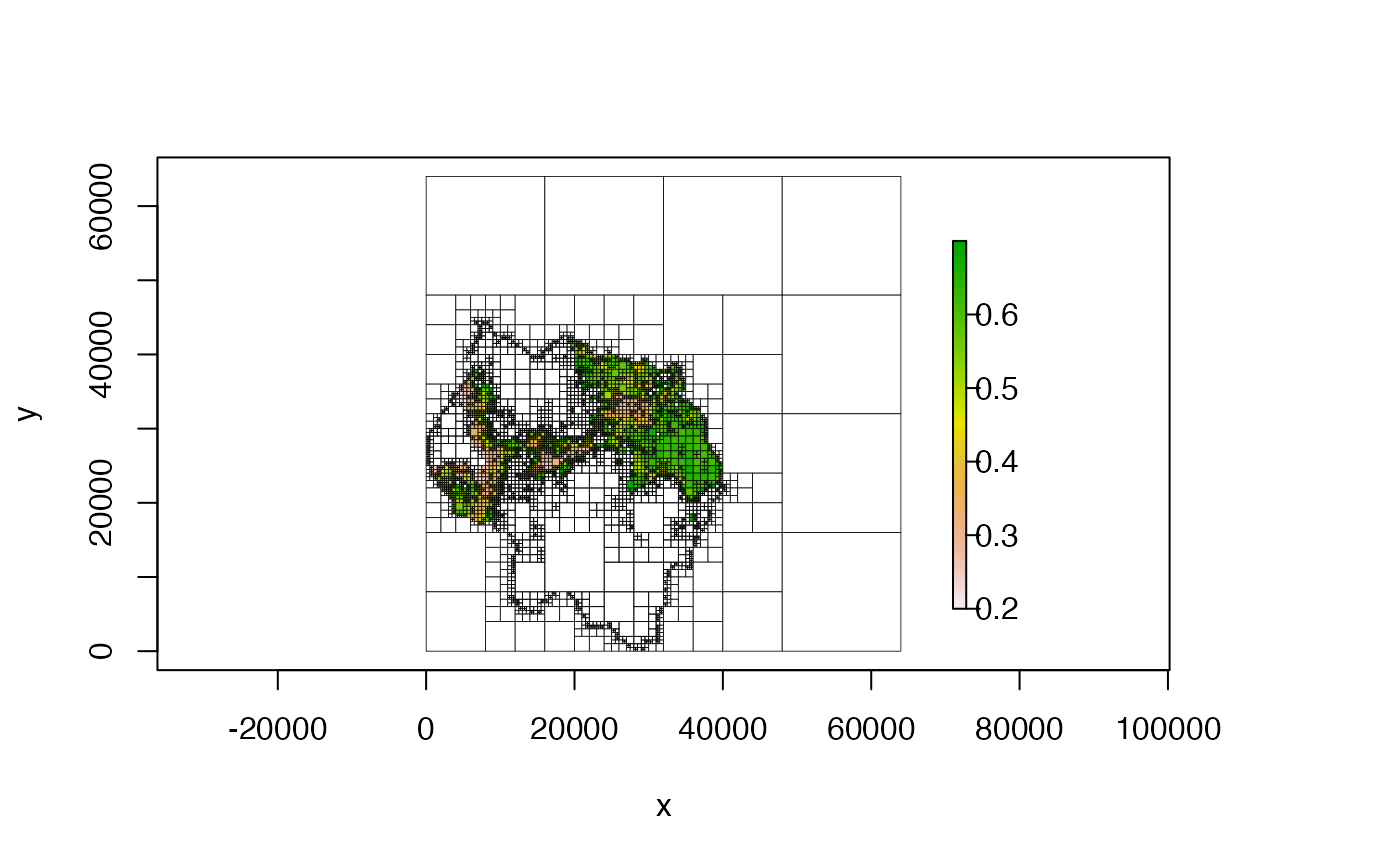
 plot(qt, zlim = c(.2, .7))
 #####################################
# SHOW NEIGHBOR CONNECTIONS
#####################################
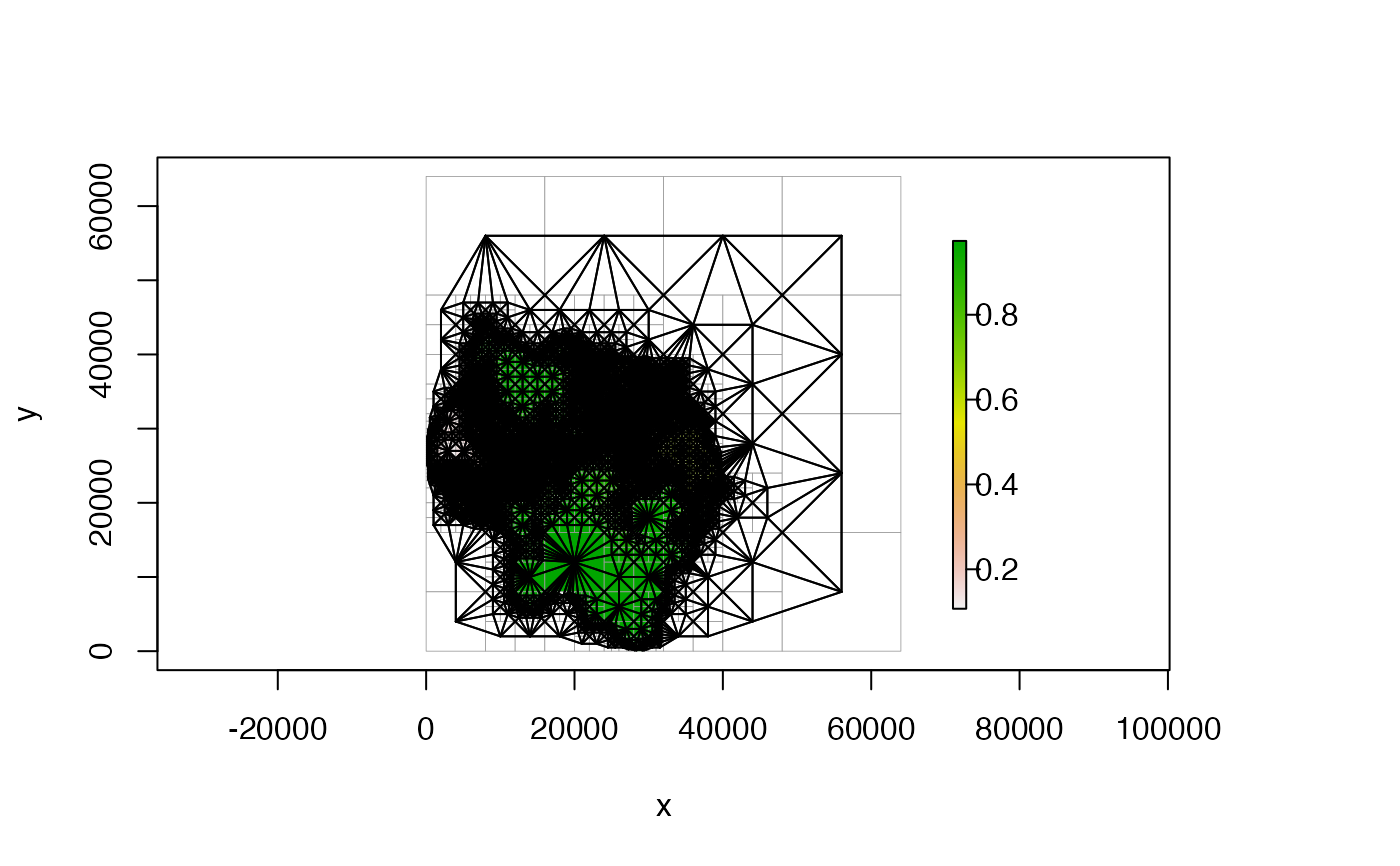
# plot all neighbor connections
plot(qt, nb_line_col = "black", border_col = "gray60")
#####################################
# SHOW NEIGHBOR CONNECTIONS
#####################################
# plot all neighbor connections
plot(qt, nb_line_col = "black", border_col = "gray60")
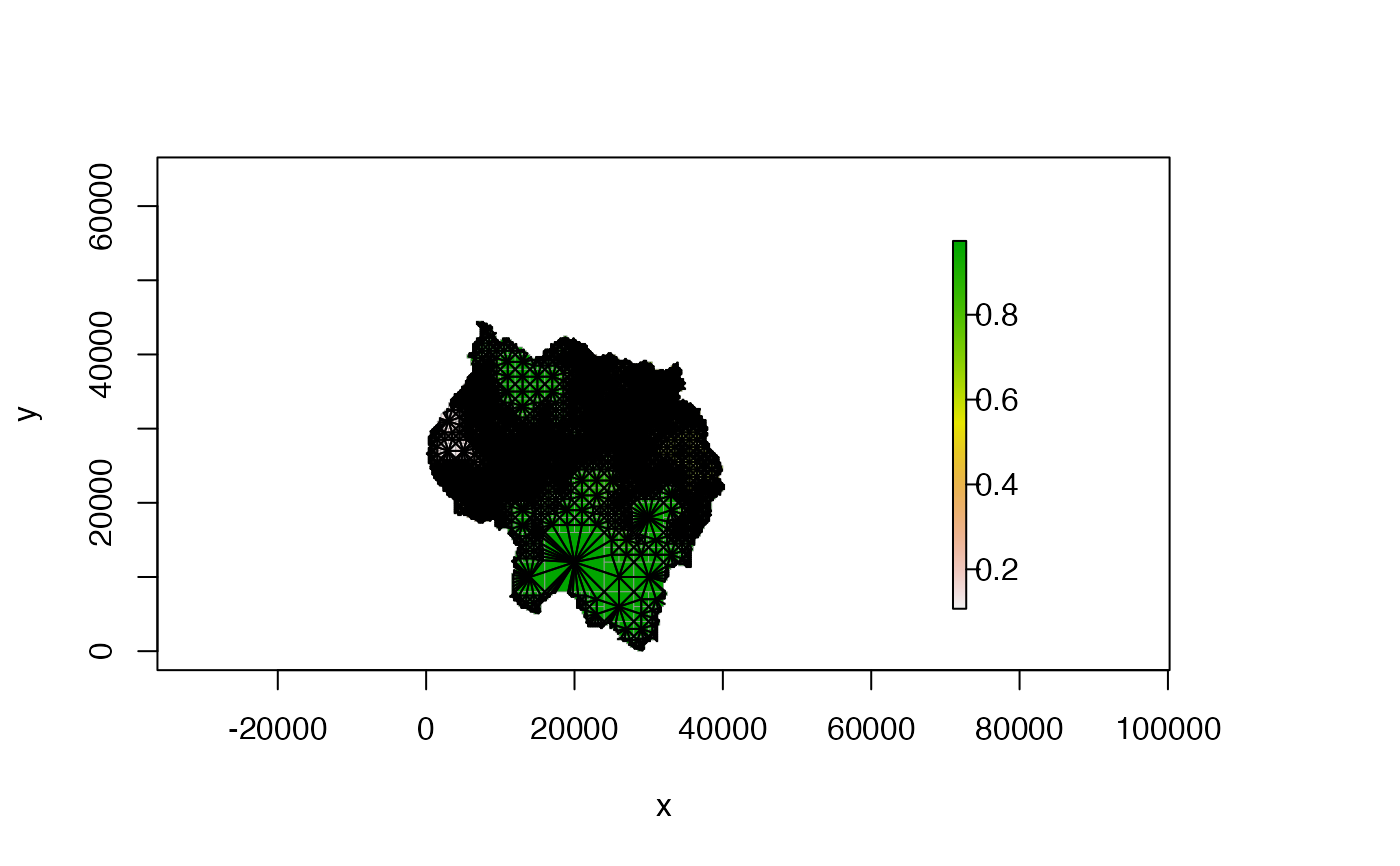
 # don't plot connections to NA cells
plot(qt, nb_line_col = "black", border_col = "gray60", na_col = NULL)
# don't plot connections to NA cells
plot(qt, nb_line_col = "black", border_col = "gray60", na_col = NULL)
 #####################################
# LEGEND
#####################################
# no legend
plot(qt, legend = FALSE)
# increase right margin size
plot(qt, adj_mar_auto = 10)
#####################################
# LEGEND
#####################################
# no legend
plot(qt, legend = FALSE)
# increase right margin size
plot(qt, adj_mar_auto = 10)
 # use 'legend_args' to customize the legend
plot(qt, adj_mar_auto = 10,
legend_args = list(lgd_ht_pct = .8, bar_wd_pct = .4))
# use 'legend_args' to customize the legend
plot(qt, adj_mar_auto = 10,
legend_args = list(lgd_ht_pct = .8, bar_wd_pct = .4))