Plots a LcpFinder object.
Arguments
- x
- add
boolean; if
TRUE(the default), the plot is added to the existing plot. IfFALSE, a new plot is created.- ...
arguments passed to the default plotting functions
Value
no return value
Details
points() plots points at the centroids of the cells to which
a path has been found. lines() plots all of the LCPs found so far by
the LcpFinder object.
Examples
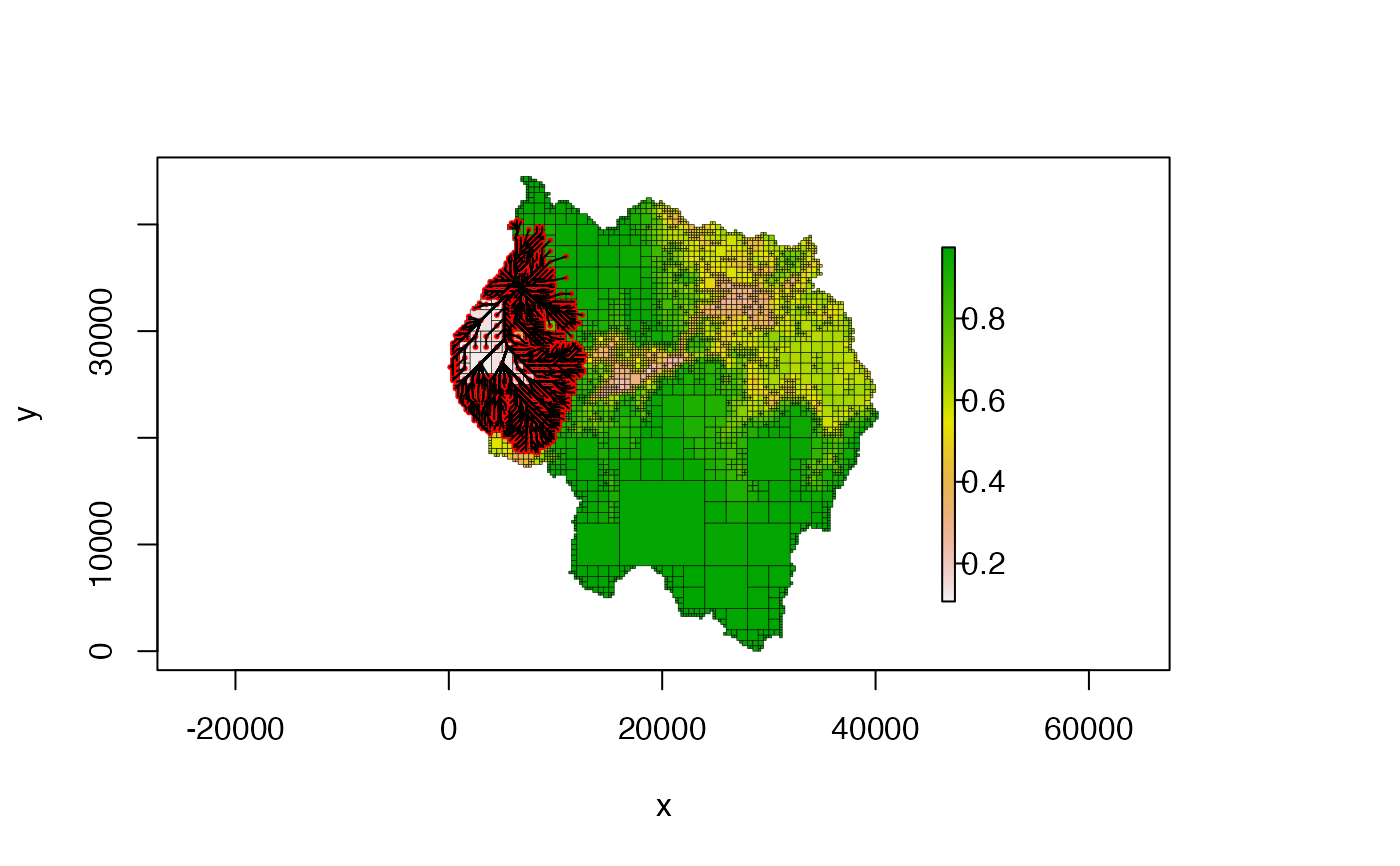
library(quadtree)
habitat <- terra::rast(system.file("extdata", "habitat.tif", package="quadtree"))

qt <- quadtree(habitat, .1)

start_point <- c(6989, 34007)
end_point <- c(12558, 27602)
lcpf <- lcp_finder(qt, start_point)
lcp <- find_lcp(lcpf, end_point)

plot(qt, crop = TRUE, border_lwd = .3, na_col = NULL)
points(lcpf, col = "red", pch = 16, cex = .4)
lines(lcpf)